
Dutch drought
Dutch
drought
2026
Minor - Information design
Interactive data visualisation website explaining the importance of groundwater in the Netherlands, complete with interactive graphs and visual elements. Made for Clever°Franke.
Interactive data visualisation website explaining the importance of groundwater in the Netherlands, complete with interactive graphs and visual elements. Made for Clever°Franke.

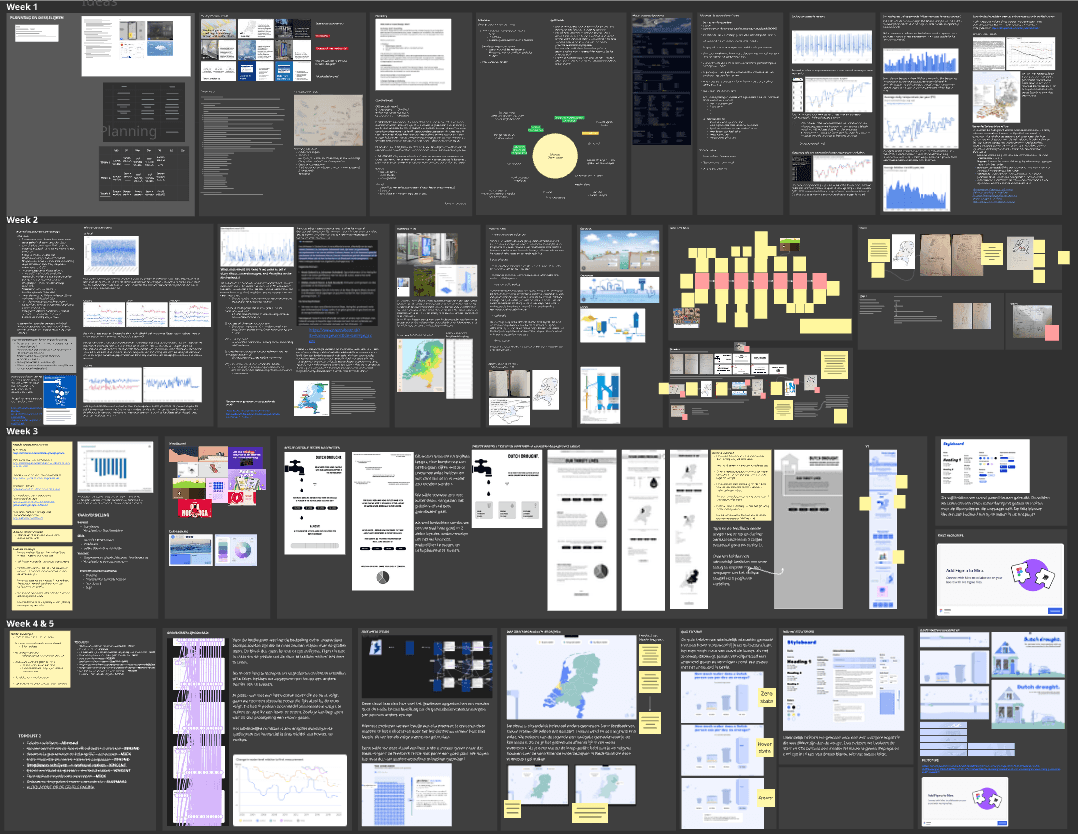
RESEARCH
Research is essential when creating a data‑driven story. You do not want to invent a story first and then look for data to match it; instead, you examine a dataset to see whether it contains interesting stories.
This was quite difficult and very time‑consuming, but it forms the foundation of your project. If this is not carried out properly, your project will have a weak basis to stand on.
RESEARCH
RESEARCH
Research is essential when creating a data‑driven story. You do not want to invent a story first and then look for data to match it; instead, you examine a dataset to see whether it contains interesting stories.
This was quite difficult and very time‑consuming, but it forms the foundation of your project. If this is not carried out properly, your project will have a weak basis to stand on.
VERSION 1
VERSION 1

For this project, there was a weekly meeting with the client Clever°Franke. In these meetings we discussed how things were going, where we stood, and we received useful feedback.
The first design round was purely to get our thoughts on paper and to make sure CleverFranke had something to look at and respond to. This resulted in many different ideas that we could then build on further or adjust as needed.
VERSION 2
VERSION 2

Version 2 was again a continuation based on the feedback received. You can see that there's a bit more content, but the form and order are certainly not set yet. This is what we also wanted feedback on this week.
The execution wasn't there yet, of course, but this was only week 3 of the project. Clever°Franke was satisfied with the direction we were heading and said we were on the right track.
VERSION 3
VERSION 3

In the final versions, you can really see the page starting to reach its final form. We're more certain about the layout, colors, and storyline. This is also the phase where the visualizations were made interactive, illustrations were created, and animations were added.
I personally find this the most fun phase, as you see your project truly come to life here. But this is also the phase that takes the most time.
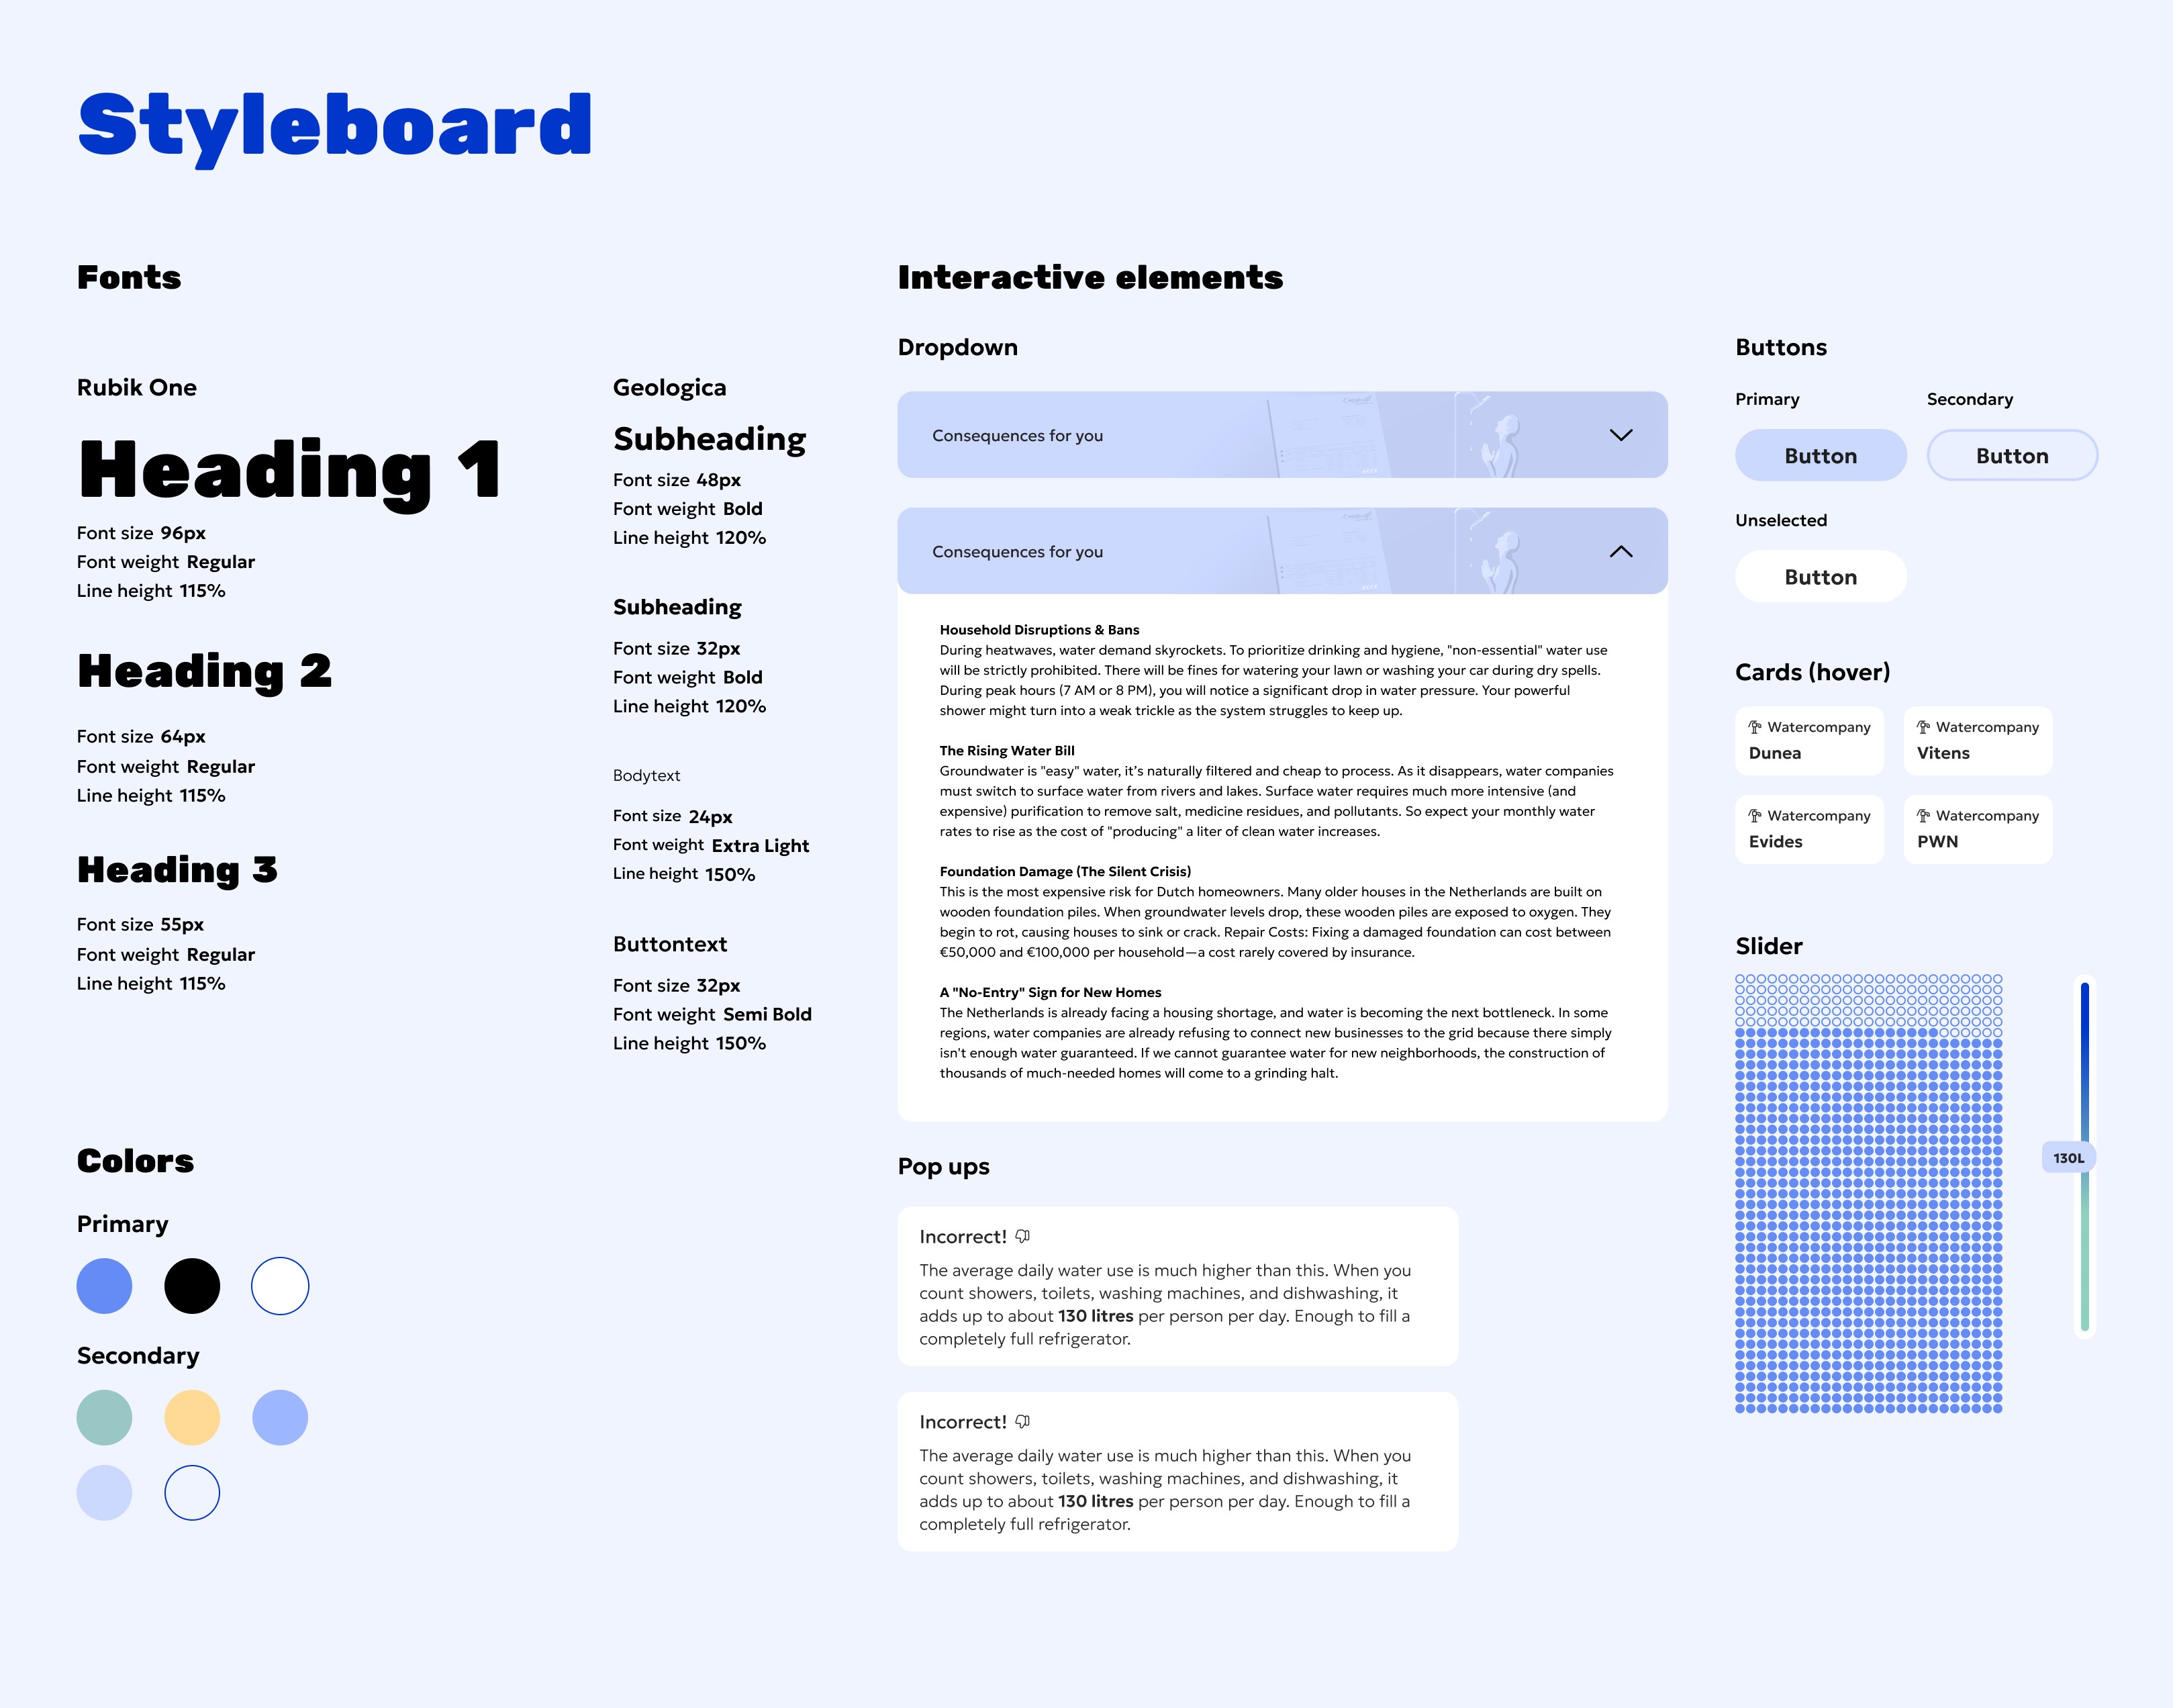
STYLEBOARD
STYLEBOARD
Finally, a styleboard is also a handy overview to have. This way, you can see at a glance what the site is built from and which heading levels, fonts, colors and buttons are used. If the project were to be continued, this would be a great guide to keep close to stay true to the predefined style.
Finally, a styleboard is also a handy overview to have. This way, you can see at a glance what the site is built from and which heading levels, fonts, colors and buttons are used. If the project were to be continued, this would be a great guide to keep close to stay true to the predefined style.
CONTACT DETAILS

© 2026 Vincent van Zeelt | UX Designer
© 2026 Vincent van Zeelt
UX Designer